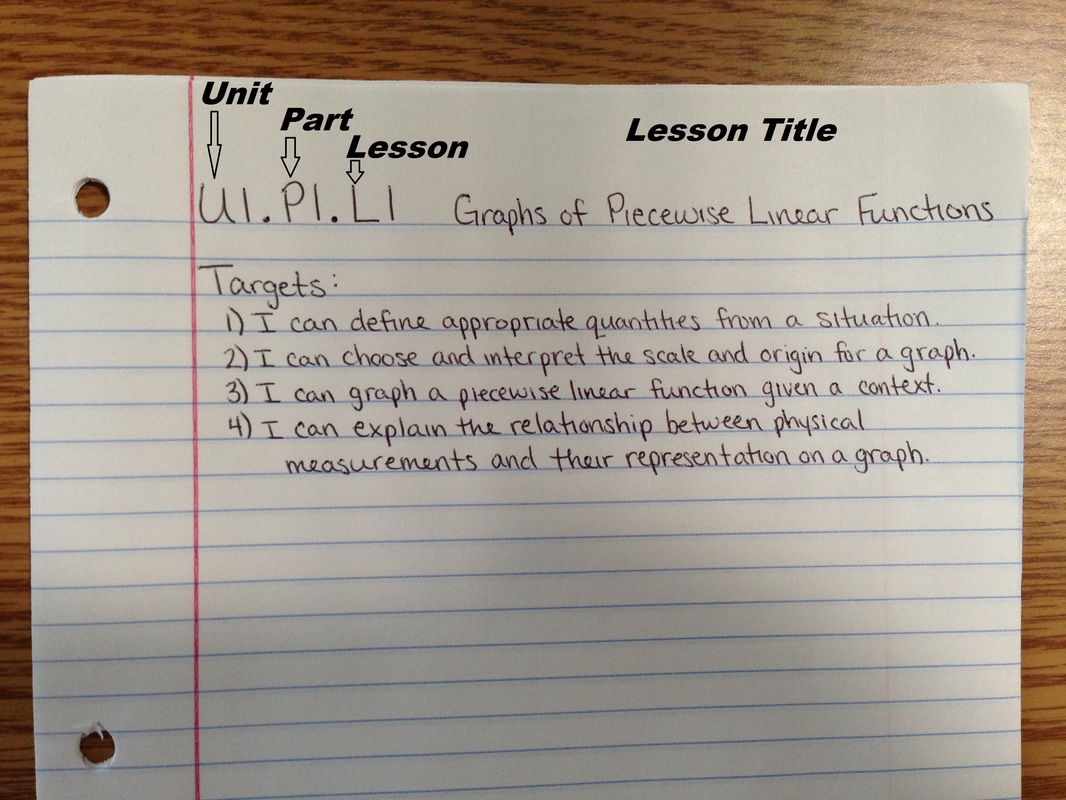
Lesson 1.1.1: Graphs of piecewise linear functions
|
For this lesson there are 11 steps for you to take. Scroll down and do each step one-by-one. The instructions under each step will help clarify exactly what you need to do, so please read all the instructions.
|
|
Here is the worksheet for Lesson 1.1.1:
|
| ||
|
2.) Watch Video
Watch this video with the intent of answering the question it poses at the beginning. If you have no idea what the question is asking you to do, don't worry, I will help after you watch the video. |
|
|
3.) Start a coordinate plane in your notes (x and y axis with labeling)
Watch the video below of me starting to create a coordinate plane where I will later graph the story from the video above. |
|
Here are some questions to consider as you fill in the graph:
- How should you label the vertical axis (y-axis)?
- What unit of measurement should we use for the vertical axis?
- How should we label the horizontal axis (x-axis)?
- What unit of measurement should we use for the horizontal axis?
- Should we measure the man's elevation from his feet or from his head?
|
4.) Check to see if your graph is appropriately labeled
Watch the video below to see how I labeled my graph. If you did it differently, raise your hand and ask me if yours is still appropriate or change yours to look like mine. |
|
5.) Graph the story...
Try to represent the elevation of the man walking down the stairs on your graph. Watch the video again, multiple times. I recommend watching it on slow motion and pausing it as you graph each data point. Then connect your dots to create a piecewise linear function.
|
6.) Watch me graph it
Watch the video below to see what I did to graph the story. See how close our answers are and if our graphs are different, ask yourself why we did it differently? |
|
|
7.) Put this graph into context
Sketch this graph into your notes (including the labels). Then think of a scenario that this graph could represent. You'll have to use your imagination. Write down what the scenario is in your notes. Then label each line of the graph explaining what it represents. Watch the next video for help. |
|
|
8.) Watch this video
This video will help you read the graph and see what scenarios might work and what won't. |
|
9.) Label all the sections (each line) of your graph
Like I started to do in the previous video, label each section of your graph to describe what is happening based on the scenario you chose.
|
10.) Watch this video and take notes This video introduces and explains what a "Piecewise Linear Function" is. Take notes on the definition and make sure to ask for help if it isn't making sense. |
|
|
11.) Exit Ticket
Watch this video and create a graph in your notes that represents the story. When you are finished, raise your hand and show me your graph. A high five is on its way :) |
|
