Lesson 1.1.3: Graphs of Exponential functions
|
For this lesson there are 14 steps for you to take. Scroll down and do each step one-by-one. The instructions under each step will help clarify exactly what you need to do, so please read all the instructions.
|
|
Here is the worksheet for Lesson 1.1.3
|
| ||
|
1.) Start your notes
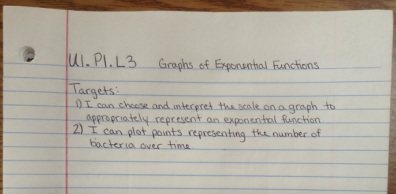
Copy the notes I have started to the right (title and targets). In this lesson we will be discovering what an exponential function looks like in graph form. |
|
|
2.) Graph the story: Example 1
Read the story to the right. Then translate the story into a graph. I am going to cut out a piece of graphing paper and tape it into my notes for this. You can do the same. |

|
|
3.) Double check your answer
Watch me graph example 1. See if we got the same result. Feel free to watch it on double speed if you want to. |
|
|
4.) Watch the following graphing story and make a table
This video shows bacteria doubling every second. Make a table that represents the number of bacteria over time. I recommend watching it on slow motion and pausing it at every second. Make sure your table goes up to 5 seconds and stop. It gets a little tricky at 4 seconds and 5 seconds, so make your best educated guess. |
|
|
5.) Double check your table
Watch the video to make sure you have appropriate data points. Feel free to put the video on double speed or just go to the end of the video. |
|
|
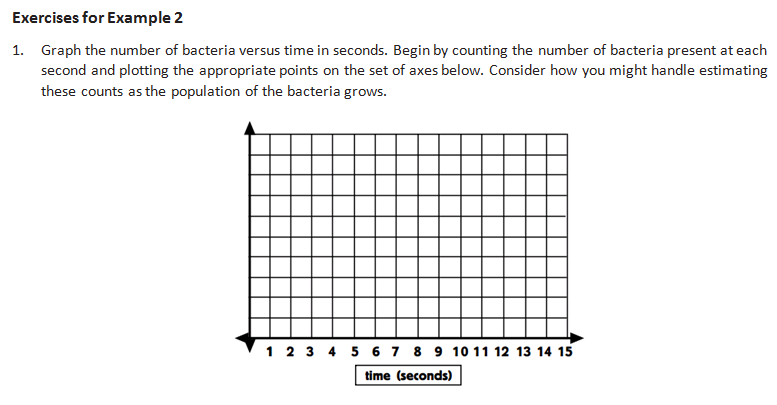
6.) Graph the data
Take the data from the Bacteria video and represent it in a graph. Follow the instructions in the picture called "Exercises for Example 2" Our table only includes data up until 5 seconds. We will have to estimate how much bacteria there will be at 6 seconds. You don't need to go further than that yet. Also, make sure your scale for your y-axis is appropriate to fit the data. |
|
|
7.) Double check your graph
Watch the video to make sure your graph is correct and listen in for some tips. |
|
8.) Quick Quiz
Hopefully you watched the bacteria video again and can answer the following questions below. Make sure to finish all the questions and click "submit."
Hopefully you watched the bacteria video again and can answer the following questions below. Make sure to finish all the questions and click "submit."
|
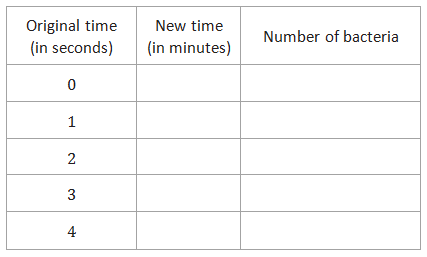
9.) Make a table in "minutes" Copy this table in your notes and fill in the missing boxes. We want to start tracking in "real time" now instead of the video time. |
|
|
10.) Double check your table
Watch this video really quick to make sure you filled in your table correctly. |
|
|
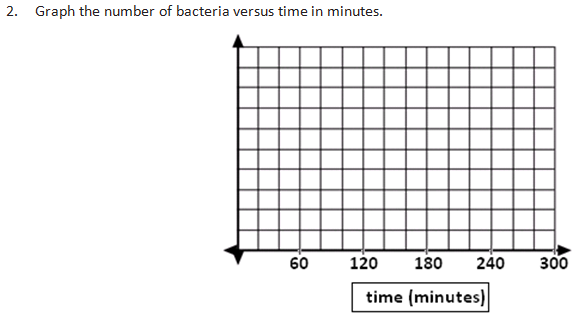
11.) Exercise 2: Graph in terms of minutes
Copy the graph to the right and fill in the data points all the way to 300 minutes. I recommend extending your table to go all the way to 300 minutes. Make sure to scale appropriately on the y-axis to fit all the bacteria! |
|
|
12.) Double check your graph
Watch this video to see how I graphed it. Make sure your graph looks similar. |
|
13.) Notes about linear, quadratic and exponential functions
Find a partner and discuss with them the differences between these 3 types of functions. Also, talk about how you might now when you see a quadratic versus an exponential function. Write down the differences in your notes.
The three types of graphs (linear, quadratic, and exponential) we have looked at over the past few days are the "pictures" of the main types of equations and functions we will be studying throughout this year.
|
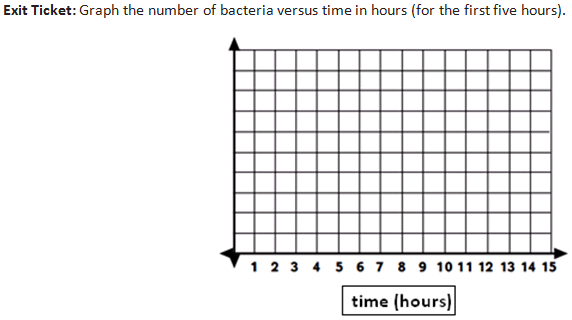
14.) Exit Ticket
Graph the same data from the bacteria video, but this time do it in terms of hours. When you are done, raise your hand and show me what you got. A high five is on its way! |
|
