Lesson 1.1.2: Graphs of Quadratic Functions
|
For this lesson there are 11 steps for you to take. Scroll down and do each step one-by-one. The instructions under each step will help clarify exactly what you need to do, so please read all the instructions.
|
|
Here is the worksheet for Lesson 1.1.2
|
| ||
|
1.) Introduction
Watch this video for a fun way to introduce the graphs of Quadratics. |
|
|
2.) Watch this video
Here is a quick warm up video to get us thinking about relationships between quantities again, kind of like the previous lesson. It is a very short video, so please watch it many times. If your neighbor is available, try to describe to them the motion of the ball. Use specific quantities to describe what is happening. Try to use the rulers they have set up to be specific. If your neighbor is not available, jot down a sentence or two describing the motion. |
|
|
3.) Watch me describe the motion
I decided to describe the motion in terms of its elevation vs. time (like the previous lesson). If you didn't have anything written down yet, copy what I have. |
|
|
4.) Graph the story of the soccer ball
Copy this blank graph in your notes and then create a graph of the elevation vs. time of the soccer ball. Make sure to...
If you need to, watch the video over and over again. |
|
|
5.) Double check your graph
Watch me graph the soccer story. If you graphed either of the options, no need to take any notes. If you don't have either of the graphs, graph the red one. |
|
|
6.) Watch video #2
Here is another video. A man who is named "Professor Splash" attempts to break a world record. He is jumping from 36ft. into a kiddy pool that is only 1 foot deep of water. As you watch it, think about how you would graph his elevation vs. time. |
|
|
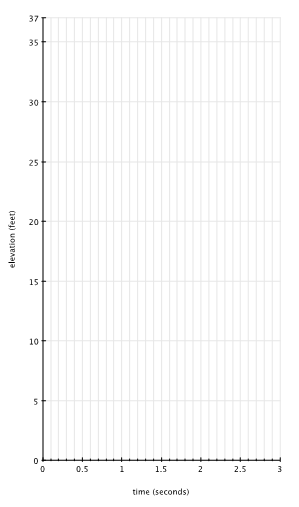
7.) Graph the story of Professor Splash
Copy the graph to the right and do your best to graph Professor Splash's jump. My advice is to watch the video again, but this time only watch from 32 seconds to 34 seconds (and watch it on slow motion by clicking on the settings button). Try to find out how much time passed for every 5 feet he travels. I am going to do the same thing, and I am going to make a table to help me graph it afterward. Keep in mind, he starts at 35.5 feet but he jumps up to 36 feet. |
|
|
8.) Double check your graph
Watch the video on how I graphed Professor Splash. Your graph doesn't have to be exactly the same, but it should be fairly close. |
|
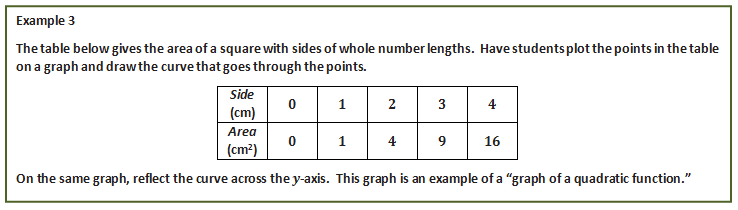
9.) Graph Example 3 Below
Take the table given in example 3 and graph it in your notes. When you make your coordinate plane, make sure to have at least quadrants 1 and 2. The sides should be your x-values and your Area should be your y-values. Make sure to reflect this data over the y-axis.
Take the table given in example 3 and graph it in your notes. When you make your coordinate plane, make sure to have at least quadrants 1 and 2. The sides should be your x-values and your Area should be your y-values. Make sure to reflect this data over the y-axis.
|
10.) Double check your graph Watch me follow the instructions from Example 3. |
|
|
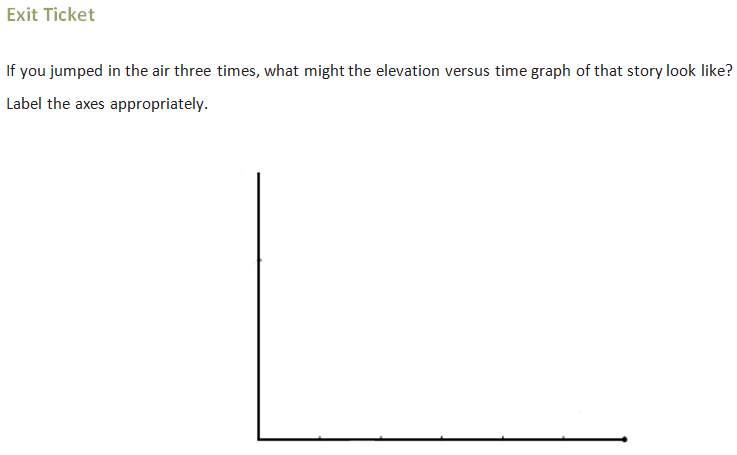
11.) Exit Ticket
Copy this graph into your notes, then graph the following story. Make sure to label each axis appropriately. If you jumped in the air three times, what might the elevation versus time graph of that story look like? Once you finish your graph, raise your hand and have me check it before you move on to the next lesson. A high five is coming your way :) |
|
