Lesson 2.2.2: Using relationships to make conclusions
|
For this lesson there are 12 steps for you to take. Scroll down and do each step one-by-one. The instructions under each step will help clarify exactly what you need to do, so please read all the instructions.
|
|
Here is the worksheet for Lesson 2.2.2.
|
| ||
1.) Start Notes: Targets
Title your notes and write the targets listed below.
Title your notes and write the targets listed below.
- I can identify which type of relationship each scatter plot has.
- I can use an equation that fits the relationship of the scatter plot to make decisions.
|
2.) Lesson Introduction
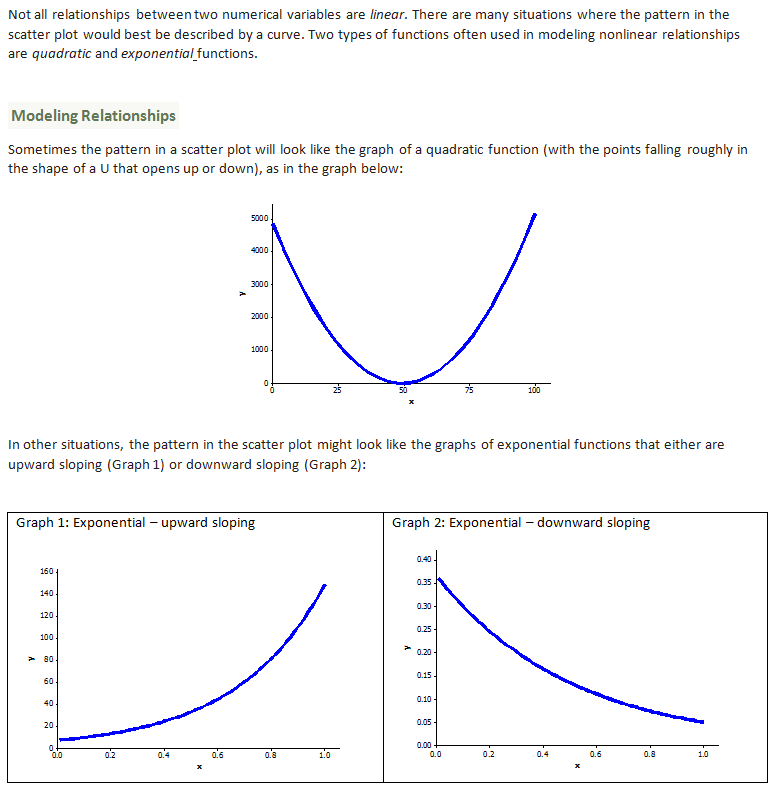
In this lesson you will learn about two new types of relationships called "quadratic" and "exponential." Please read through the introduction on the right and write a definition for each new relationship. Add the graphs as an example for each new relationship. |
|
|
3.) Video: Introduction
Watch this video to see what I wrote down for my definitions of each type of new relationship. If you don't have the notes I have, make sure you copy them down. |
|
|
4.) Notes: Practice 1
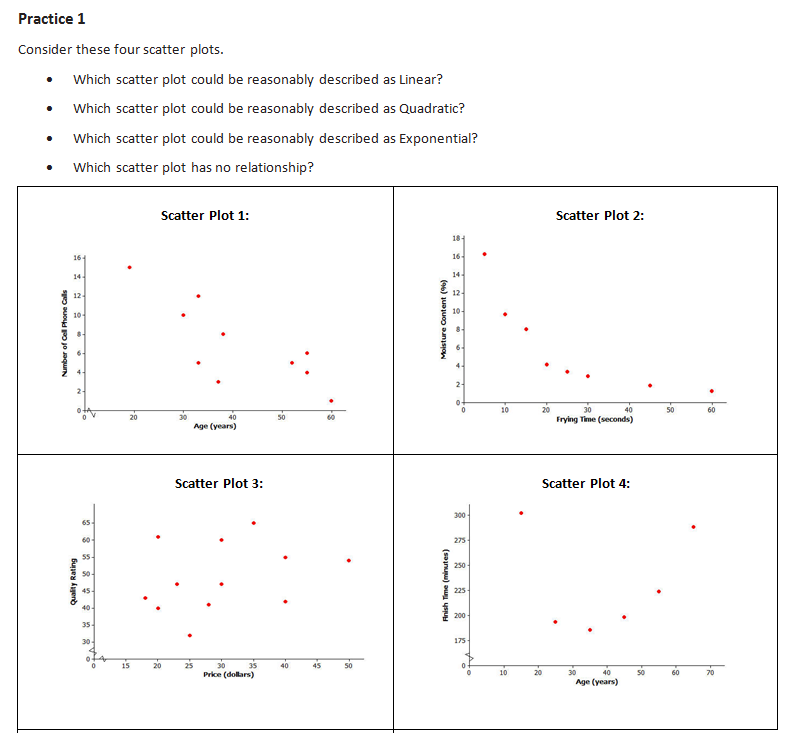
When we see scatter plots from now on you should be able to identify them based on their relationship. Are they linear, quadratic, exponential, or do they have no relationship? In Practice 1 you will be testing out your ability to identify the different relationships. Sketch each scatter plot into your notes and then identify what relationship the two variables have. |
|
|
5.) Video: Practice 1
Watch this video to see how I identified each scatter plot from Practice 1. |
|
|
6.) Notes: Practice 2
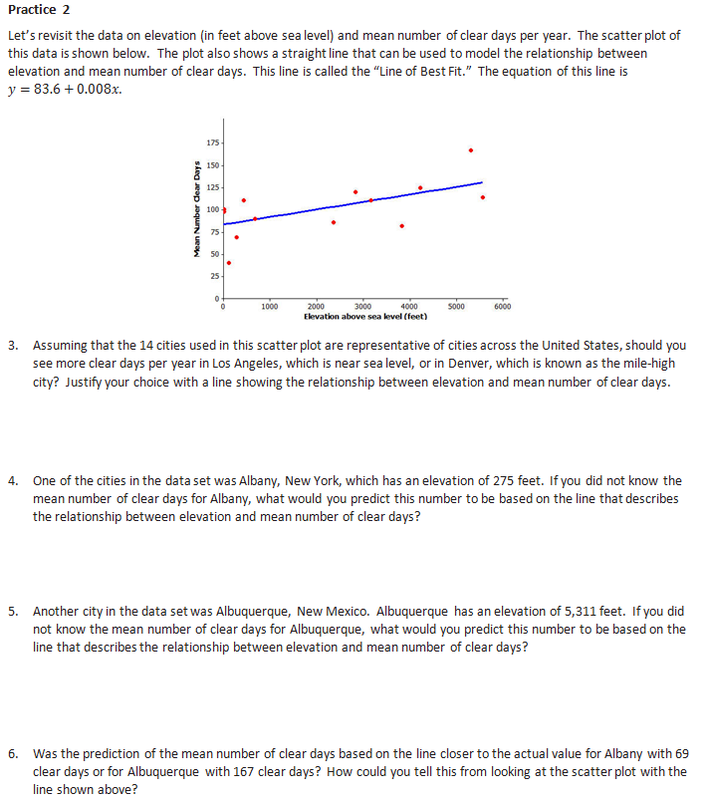
First, do your best to copy this example into your notes. It is okay if it is not perfect, but you will want an example to reference in your notes. Then read through the description of the "Line of Best Fit." A line of best fit is used to make predictions based on the relationship described by the scatter plot. Use the line of best fit to answer parts 3-6. |
|
|
7.) Video: Practice 2
Watch this video to see how I worked through the questions from Practice 2. |
|
|
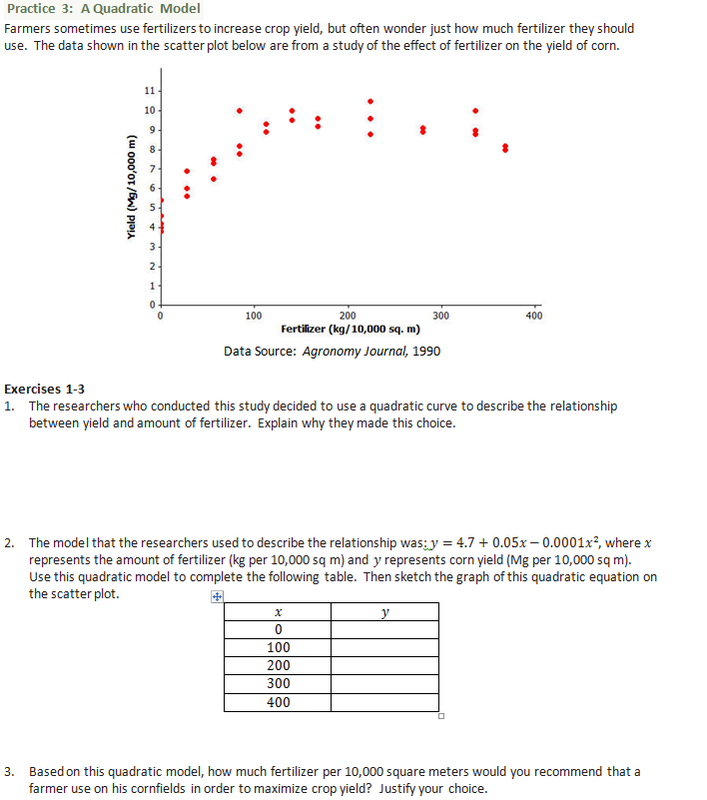
8.) Practice 3
|
|
|
9.) Video: Practice 3
Watch this video to see how I worked through Practice 3. |
|
|
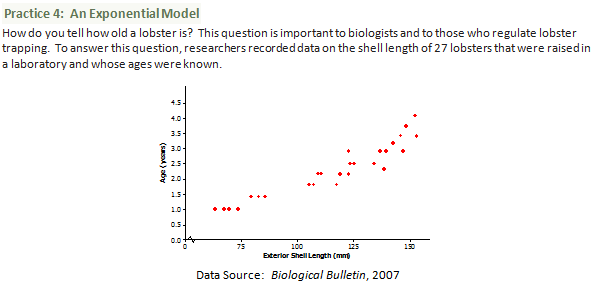
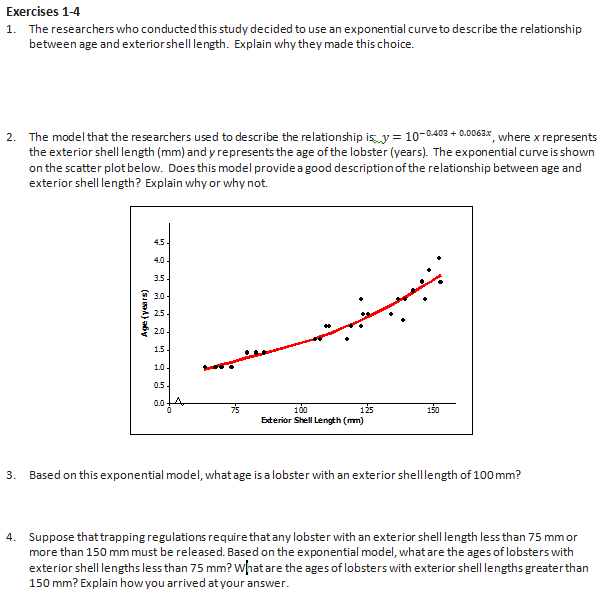
10.) Practice 4
|
|
|
11.) Video: Practice 4
Watch this video to see how I worked through Practice 4. |
|
|
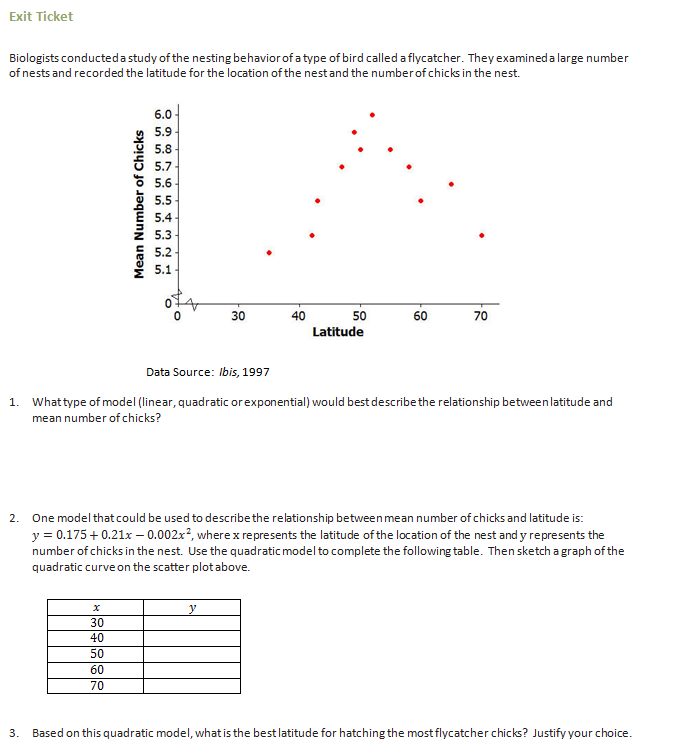
12.) Exit Ticket
First, sketch the scatter plot into your notes. Then answer the 3 questions. When you are done, show me your awesome work. A high five is on its way :) |
|
