Lesson 2.2.5:
|
For this lesson there are 15 steps for you to take. Scroll down and do each step one-by-one. The instructions under each step will help clarify exactly what you need to do, so please read all the instructions.
|
1.) Start Notes: Targets
Title your notes and write the targets listed below.
Title your notes and write the targets listed below.
- I can use technology to find the value of the correlation coefficient for a given data set.
- I can use the correlation coefficient to measure the strength and direction of a linear relationship.
|
2.) Notes: Warm Up
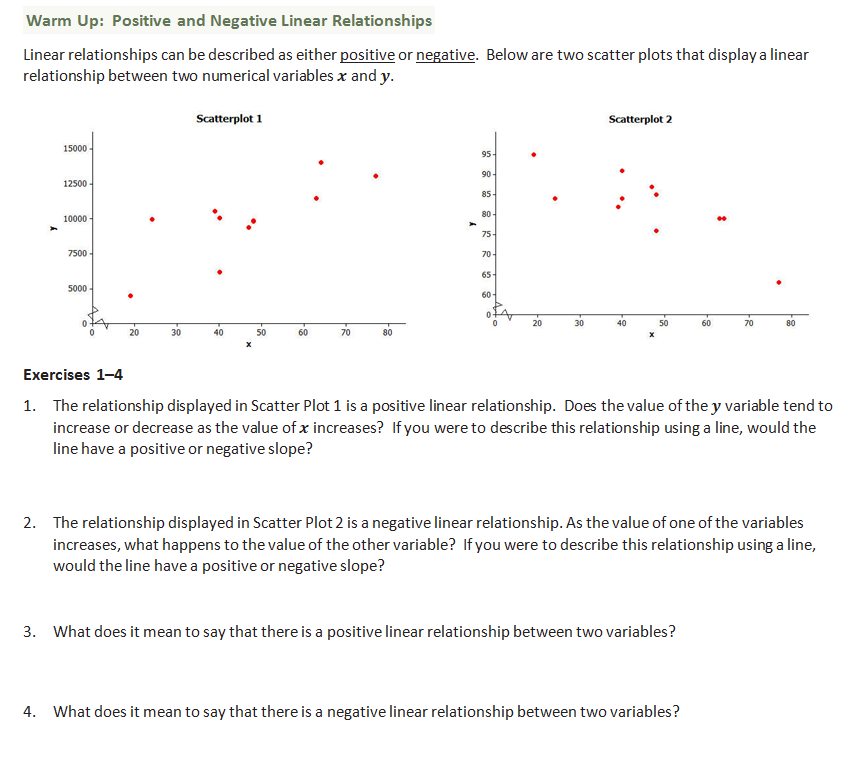
You have probably learned in the past that lines either have a positive or negative "slope." The same idea can be applied to scatter plots. 1.) Sketch the scatter plots into your notes. 2.) Answer questions 1-4 by applying what you already know about positive and negative slopes. |
|
|
3.) Video: Warm Up
Watch this video to see how I think through exercises 1-4 from the warm up. |
|
|
4.) Notes: Practice 1
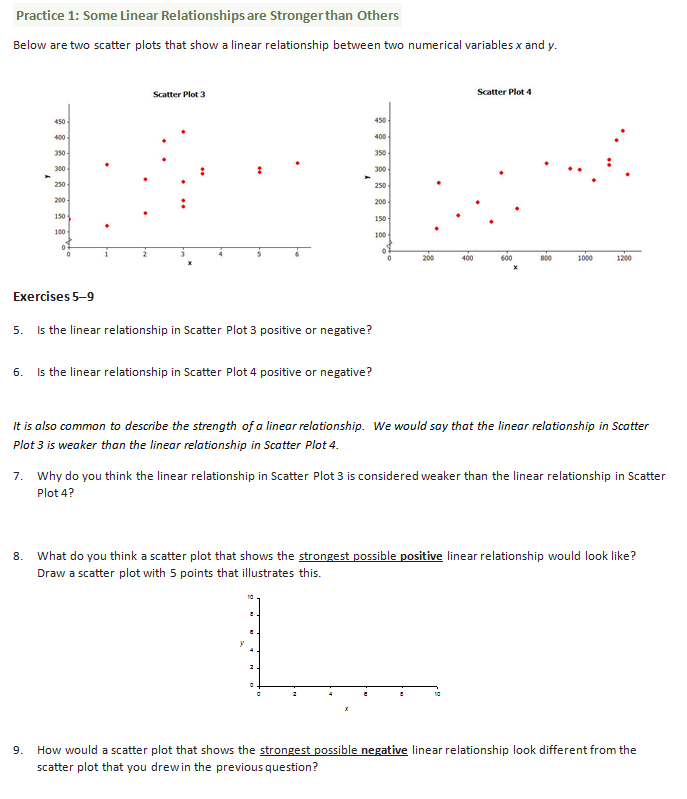
The warm up talked about how scatter plots can have positive or negative linear relationships. In Practice 1 we will discover that linear relationships have different degrees of strength. 1.) Sketch the two scatter plots into your notes. 2.) Use what you learned from the warm up to answer exercises 5 - 7. 3.) Make up your own scatter plot for part 8 and 9. |
|
|
5.) Video: Practice 1
Watch this video to see how I worked through Practice 1. |
|
|
6.) Notes: Practice 2
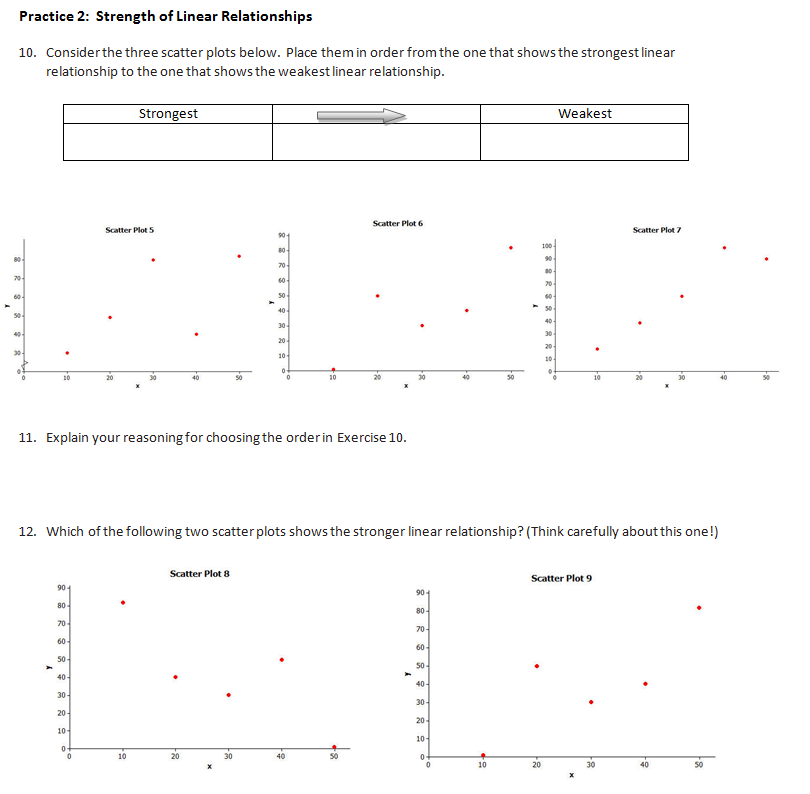
Explore a little more the idea of strength of a linear relationship. See if you can place the 3 scatter plots in order from strongest to weakest. And make sure you are thinking about what makes them strong or weak. Then do the same for the last two scatter plots. |
|
|
7.) Video: Practice 2
Watch this video to get some insight about what makes a scatter plot have a strong or weak linear relationship. |
|
|
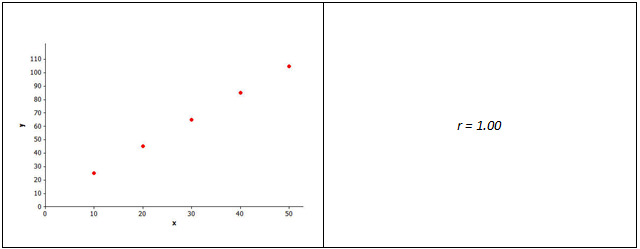
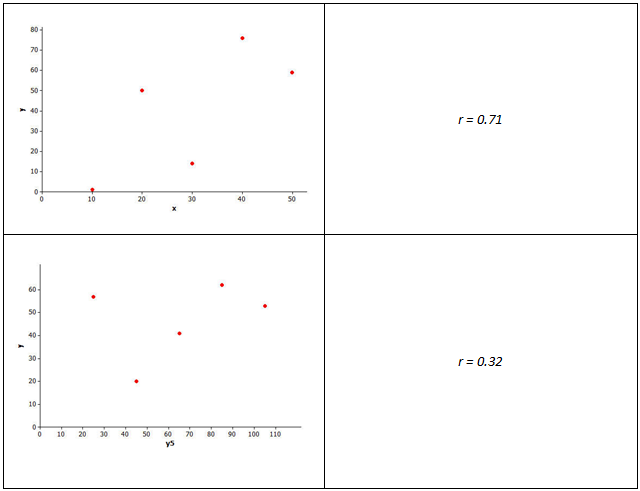
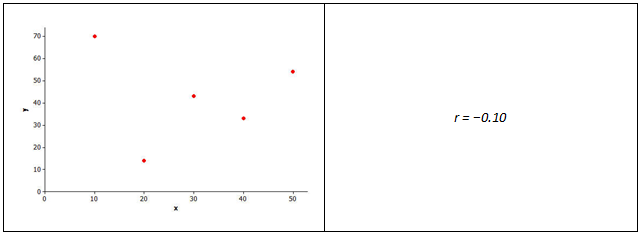
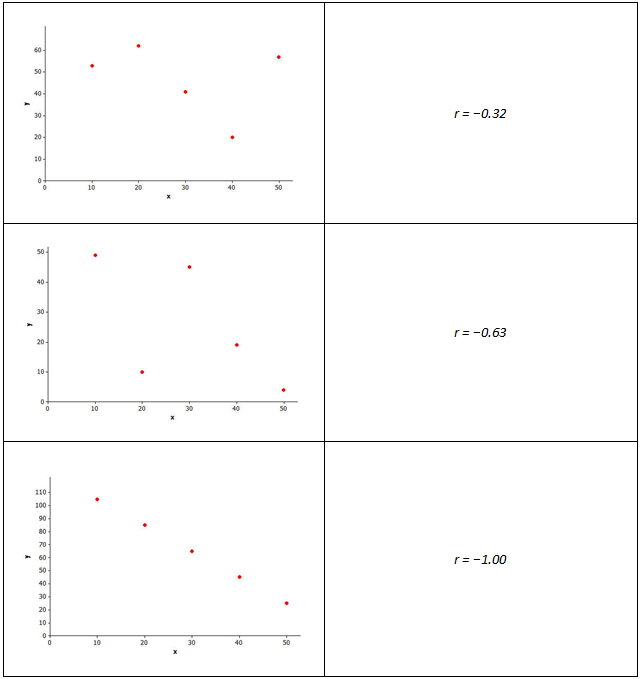
8.) Investigate: Correlation Coefficient
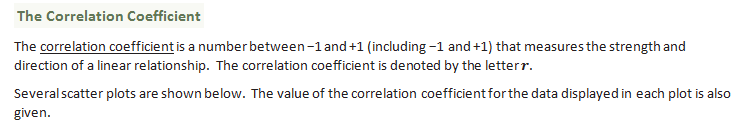
Now we introduce the "Correlation Coefficient." 1.) Write down the definition for correlation coefficient. 2.) Look through all the scatter plots to try to discover what the correlation coefficient measures. Try to find the pattern. If you want, you can copy the scatter plots and their correlation coefficients. |
|
|
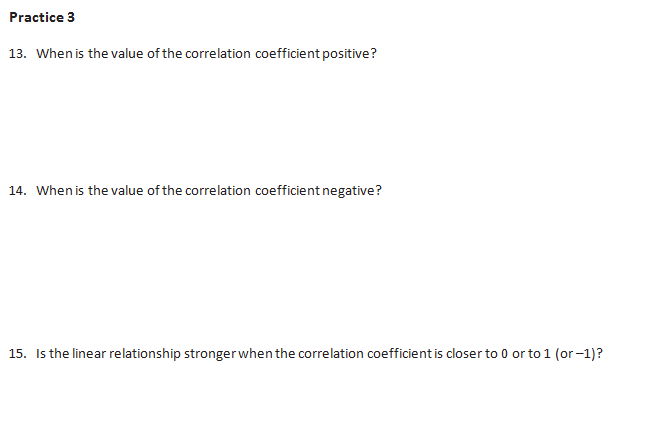
9.) Notes: Practice 3
Practice 3 is all about coming up with an idea of what the correlation coefficient does. Use what you discovered in the last investigation to answer questions 13-15. |
|
|
10.) Video: Practice 3
Watch this video to see how I answered questions 13-15. I also introduce the rules to the correlation coefficient, so watch the whole thing. |
|
|
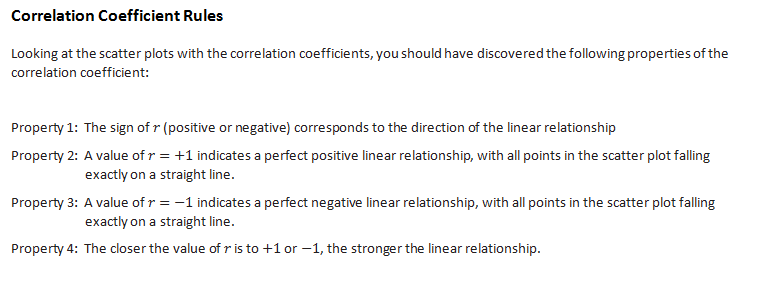
11.) Notes: Correlation Coefficient Rules
Here are the rules for the correlation coefficient. Make sure you have these written down. |
|
|
12.) Video: Using a Calculator
I have good news... you can use a calculator to find the correlation coefficient!! Watch this video to see how. |
|
|
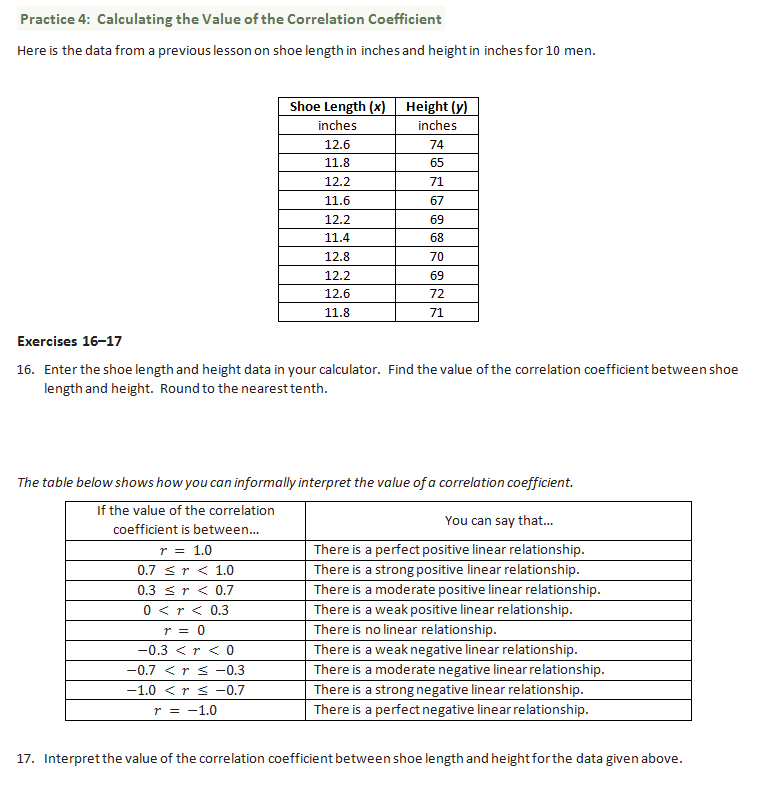
13.) Notes: Practice 4
Now that you know how to find the correlation coefficient with a calculator, here is your chance to practice using it. Make sure to copy the table down that describes how to interpret different correlation coefficients. |
|
|
14.) Video: Practice 4
Watch this video to see how I worked through Practice 4. |
|
|
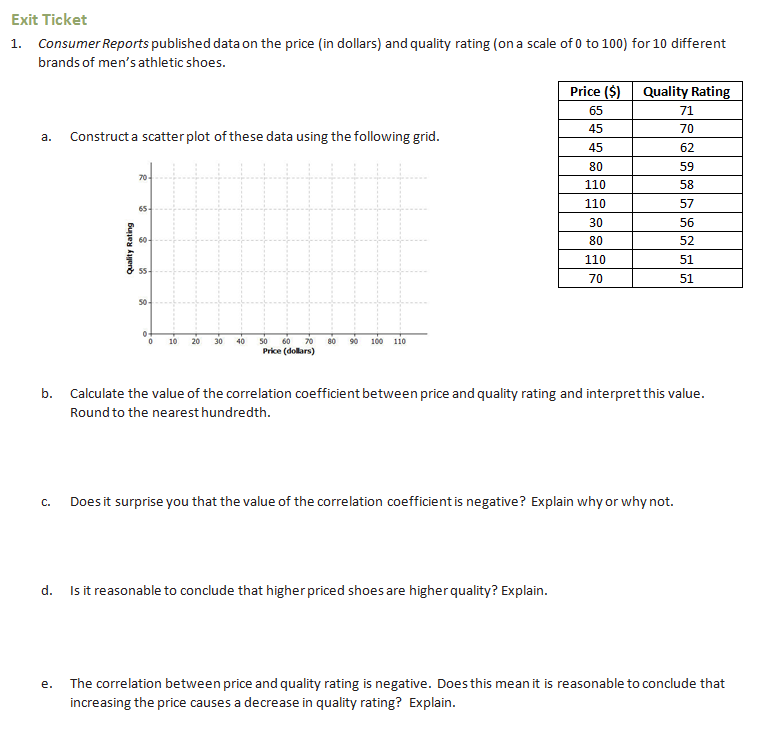
15.) Exit Ticket
Now it is your turn to show what you know! When you are done with the exit ticket, show me your awesome work. A high five is on its way :) |
|
