Lesson 2.2.1: Relationships between 2 numerical variables
|
For this lesson there are 14 steps for you to take. Scroll down and do each step one-by-one. The instructions under each step will help clarify exactly what you need to do, so please read all the instructions.
|
|
Here is the Lesson 2.2.1 Worksheet
|
| ||
1.) Start Notes: Targets
Title your notes and write the targets listed below.
Title your notes and write the targets listed below.
- I can identify whether two variables have a relationship based on their scatter plot.
- I can determine whether scatter plots have a linear relationship or a nonlinear relationship.
2.) Warm Up: Background Info
A scatter plot is an informative way to display numerical data with two variables. In your previous work in Unit 10 of Pre-Algebra or your work in Middle School, you saw how to construct and interpret scatter plots. Recall that if the two numerical variables are denoted by x and y, the scatter plot of the data is a plot of the (x, y) data pairs.
As a way to warm up for this lesson, work on this Khan Academy activity. It will get your mind ready for the work we will be doing throughout this Unit. Try to get 5 right in a row before moving on in this lesson.
Constructing Scatter Plots
|
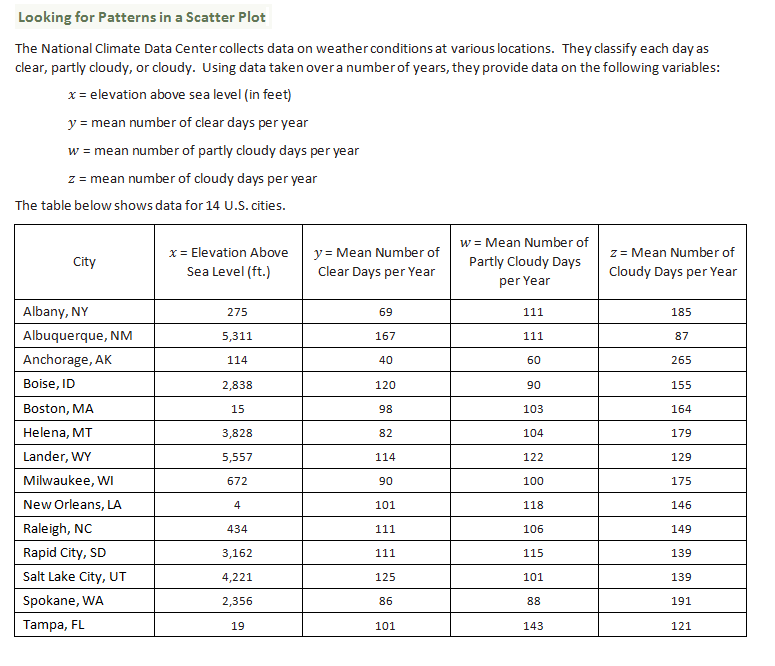
3.) Data: Setting Up the Lesson
We will be using this data to help us understand how to read scatter plots. Read through the scenario and look through the data. Then move on to the next part. |
|
|
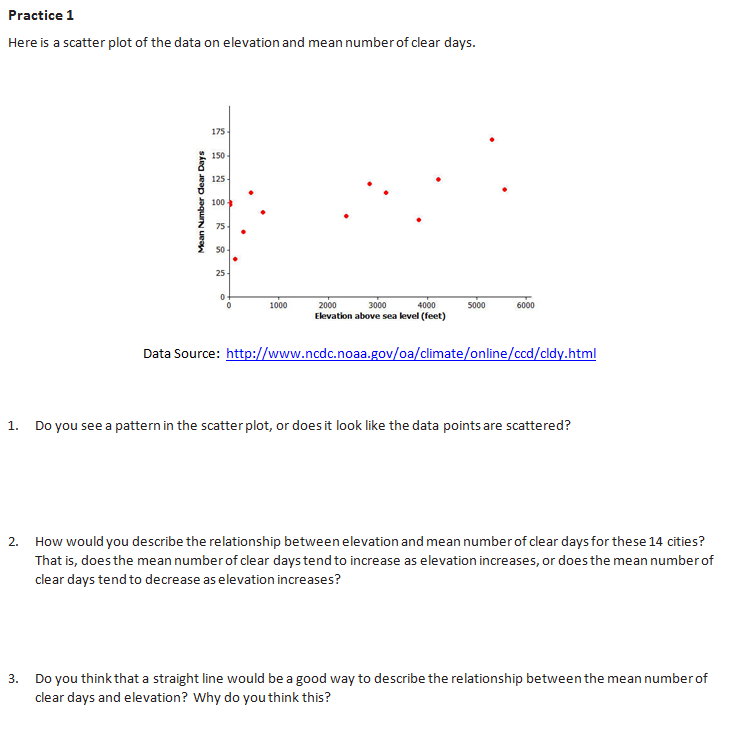
4.) Notes: Practice 1
Look at the scatter plot given to the right. Notice that it gives the data for x and y from the table above. First, copy the scatter plot into your notes. It does not need to be perfect, but you need something in your notes to reference while you answer the questions. Next, answer questions 1-3 into your notes as well. |
|
|
5.) Video: Practice 1
Watch this video to see what I discovered about the scatter plot from Practice 1. |
|
|
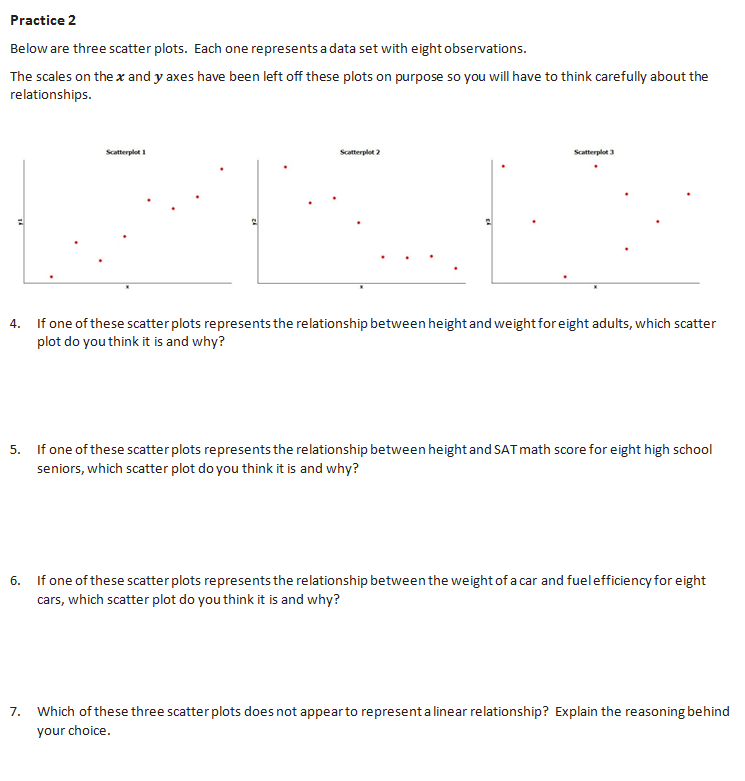
6.) Notes: Practice 2
Now we will explore the idea that different "variables" have different relationships. For instance, the relationship between a person's height and weight is going to be different than the relationship between a person height and their SAT scores. First, copy a rough sketch of each scatter plot into your notes. Then read questions 4-7 and decide which scatter plot goes with each scenario. |
|
|
7.) Video: Practice 2
Watch this video to see what scatter plots I matched up with each scenario from Practice 2. |
|
|
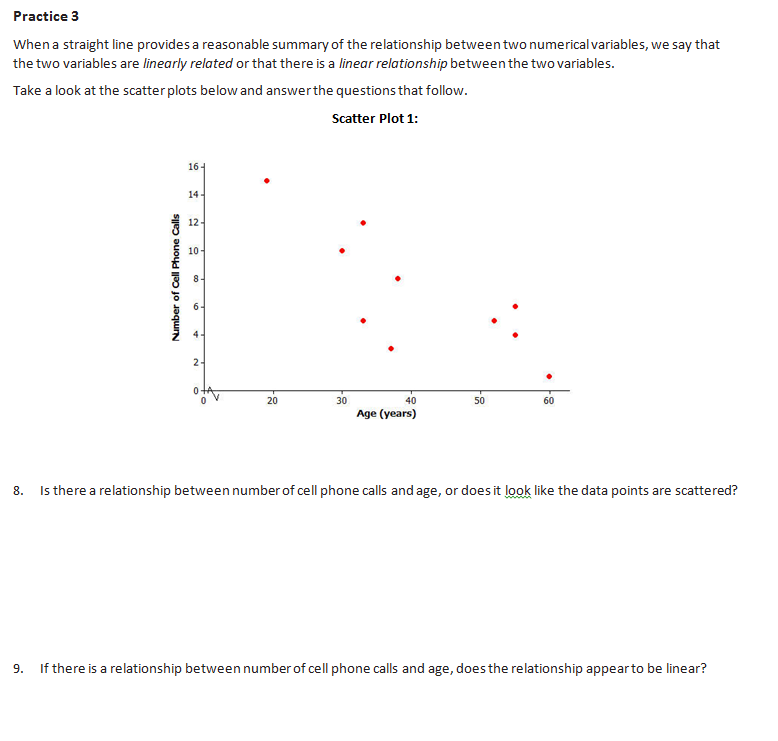
8.) Notes: Practice 3
First, write a definition for "Linear Relationship." Second, sketch this scatter plot into your notes. Then answer questions 8 and 9 in regards to the scatter plot. |
|
|
9.) Video: Practice 3
Watch this video to see my definition of Linear Relationship and what I think about the scatter plot from practice 3. |
|
|
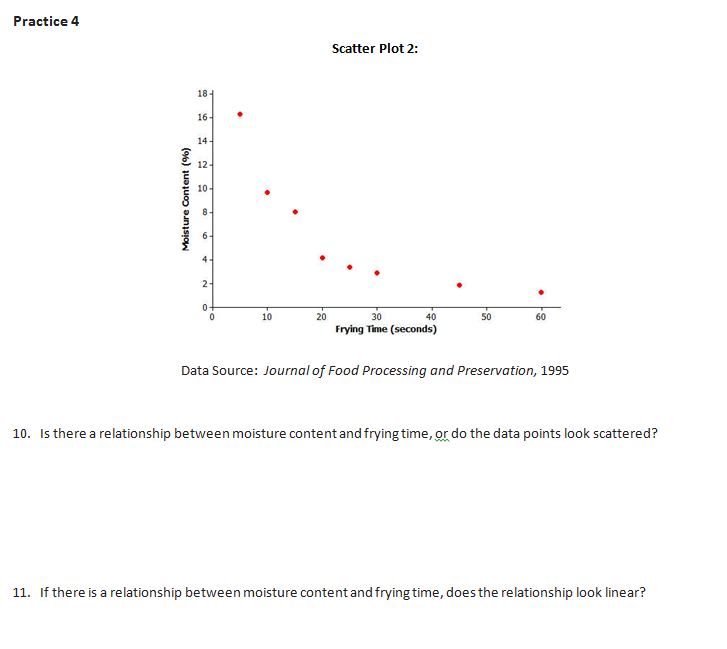
10.) Notes: Practice 4
Sketch this scatter plot into your notes and answer questions 10-11. |
|
|
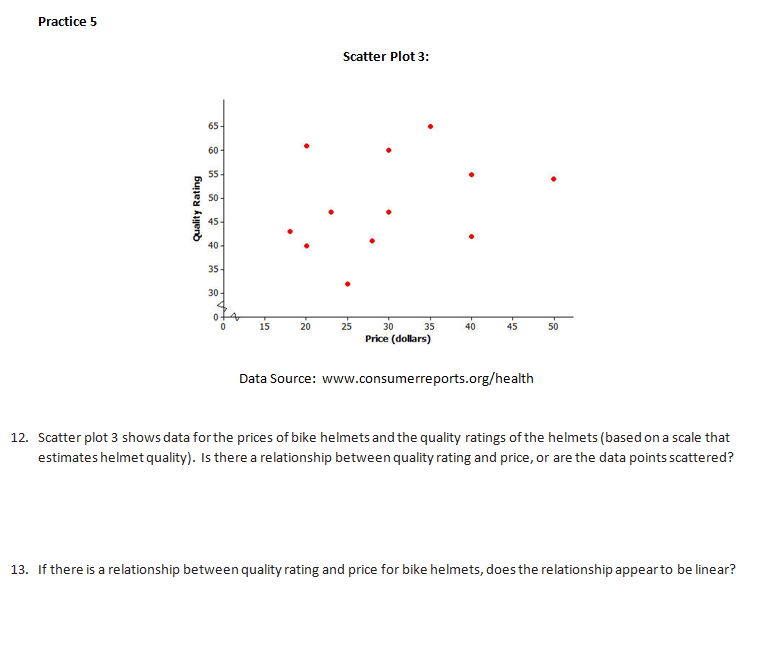
11.) Notes: Practice 5
Sketch this scatter plot into your notes and answer questions 12 and 13. |
|
|
12.) Video: Practice 4
and 5 Watch this video to see what I discovered about the scatter plots in practice 4 and 5. |
|
|
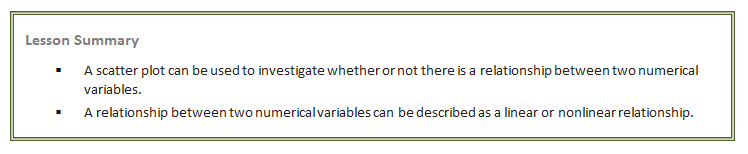
13.) Lesson Summary
Read through this lesson summary and take notes as needed. |
|
|
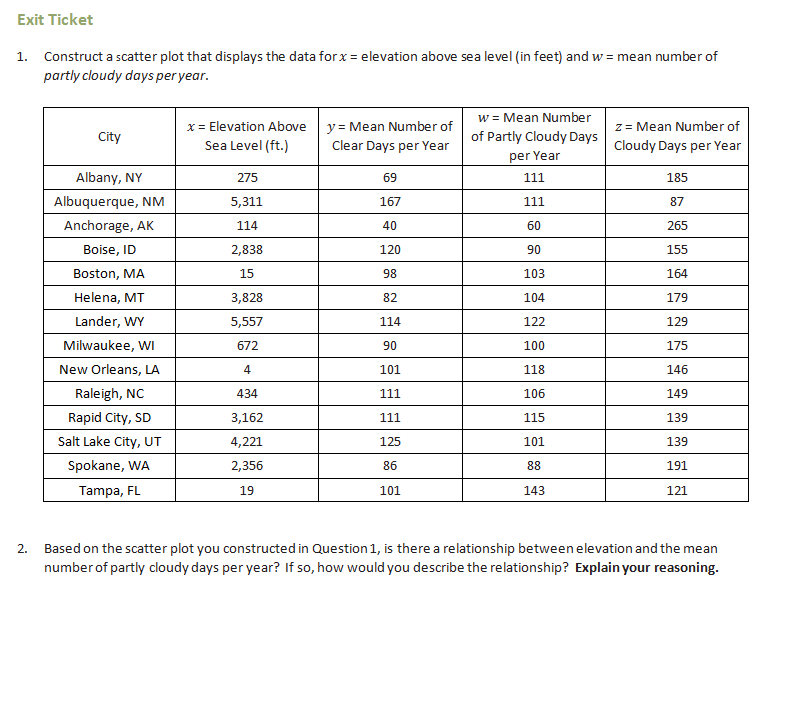
14.) Exit Ticket
For your exit ticket you will revisit the data we started with in this lesson. Construct a scatter plot to see if there is a relationship between elevation and number of cloudy days each year. After you have made your scatter plot and answered question 2, raise your hand and show me your awesome work. A high five is on its way :) |
|
