Lesson 1.1.4
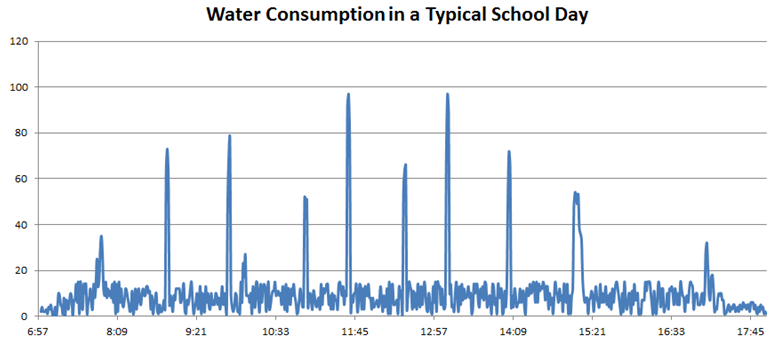
analyzing graphs: water usage during a day at school
|
Here is the worksheet for Lesson 1.1.4
|
| ||
1.) Notes: Targets
Write down these targets in your notes. Make sure you notes are titled appropriately too.
Targets:
Write down these targets in your notes. Make sure you notes are titled appropriately too.
Targets:
- I can discern units for quantities in real-world situations.
- I can choose levels of accuracy appropriate to limitations on measurement.
- I can interpret the meaning of features appearing in graphs.
2.) Check out this graph with a partner
Take a good long look at this graph. Your goal is to have a good understanding of the data. Grab a partner or get in a small group and discuss the following questions about the graph. If you would like the graph to be bigger, right click and open it in a new tab and zoom in (if you are using a Chromebook, hold "alt" and tap the image and then open in a new tab). Again, please make sure to discuss these questions with a partner. If nobody is on the same lesson as you, ask a neighbor to hold off on their work to go over these questions for a minute.
Take a good long look at this graph. Your goal is to have a good understanding of the data. Grab a partner or get in a small group and discuss the following questions about the graph. If you would like the graph to be bigger, right click and open it in a new tab and zoom in (if you are using a Chromebook, hold "alt" and tap the image and then open in a new tab). Again, please make sure to discuss these questions with a partner. If nobody is on the same lesson as you, ask a neighbor to hold off on their work to go over these questions for a minute.
- For what purposes is water used at school? (specifically what is the main use)
- What do you think the numbers along the horizontal axis represent?
- What might the numbers along the vertical axis represent? (there is no indication of the units being used)
- What could be the reason for the "spikes" in the graph?
- What might be the reason for the smaller spikes between the large ones?
|
3.) Watch the video
Listen in as I interview my wife. I ask her the same questions you were asked above. Hear what she thinks. |
|
4.) Read the additional information
Here are some extra pieces of information about the school day at this school.
Look back to the graph. Can you see the features of this information appearing in the graph?
Here are some extra pieces of information about the school day at this school.
- Regular school day hours: 8:00 a.m. - 3:04 p.m.
- After school activities: 3:15 p.m. - 5:15 p.m.
- Around 10:00 a.m. there is a 13 minute advisory/homeroom period.
Look back to the graph. Can you see the features of this information appearing in the graph?
|
5.) Watch the video
Here I am showing where the additional information shows up on the graph. |
|
6.) More additional information: please read
The researchers who collected this data watched the school’s water meter during a 12-hour period. The meter shows the total amount of water (in gallons) that has left the school since the time the meter was last set to zero. Since the researchers did not know when this resetting last occurred, they decided, at each minute mark during the day, to measure how much the meter reading increased over the next minute of time. Thus the value "80" at the 10:00 a.m. mark on the graph means that 80 gallons of water flowed through the meter and thus left the school during the period from 10:00 a.m. to 10:01 a.m.
7.) Exercise 1: read and calculate
Read the problem and answer the question at the end. Please attempt this problem on your own before you watch the next video.
Read the problem and answer the question at the end. Please attempt this problem on your own before you watch the next video.
- The bulk of water usage is due to the flushing of toilets. Each flush uses 2.5 gallons of water. Samson estimates that 2% of the school population uses the bathroom between 10:00 a.m. and 10:01 a.m. right before homeroom. What is a good estimate of the population of the school?
|
8.) Watch the video
Watch how I answered the question from part 7. Let me know if you have any questions about how I did it. |
|
9.) Exit Ticket
Answer the following questions about your very own school! Write your answers in your notes. When you are done, raise your hand so I can see your work. A high five is on its way!
Answer the following questions about your very own school! Write your answers in your notes. When you are done, raise your hand so I can see your work. A high five is on its way!
- Make a guess as to how many toilets are at the school.
- Make a guess as to how many students attend your school.
- What percentage of students do you think use the bathroom between classes?
- What about the percent of students who use it just before school and just after school?
- Are there enough toilets for all the people who want to use them to use them at the same time?
- Considering all your answers to the previous questions, estimate the number of students using the bathroom during the peak minute between classes (the one minute between classes that most people want to use the bathroom).
- Assuming each flush uses 2.5 gallons of water, estimate the amount of water being used during that peak minute.
- What time of day do these breaks occur? (when are your passing periods)
- Draw a graph that could represent the water consumption in a typical school day of your school.
